LASSO regularized multinomial regression for out-of-sample prediction of smoking status based on DNA methylation scores
Introduction
-
In epidemiological association models, it is common practice to include health/environmental risk factors as covariates to account for their potential confounder effects. However, risk factors are usually self-reported, which may comprise some latent inaccuracy.
-
DNA methylation levels across individual CpGs, may provide better biological insight into signatures of molecular accumulation of environmental exposures, such as smoking behavior.
-
Although good predictors exist for distinguishing current versus never smoking status, they performed poorly when identifying former smokers (see Elliot et al).
-
Shenker et al, developed a methylation predictor comparing former vs never-smokers, based on bisulfite conversion pyrosequencing assays. However, the results needed replication in larger samples.
-
We aimed to develop a DNA methylation-based predictor, using a least absolute shrinkage and selection operator (LASSO) multinomial regression model, to assess predictive accuracy of smoking behaviour, by out-of-sample prediction.
Cohort Description & Methods
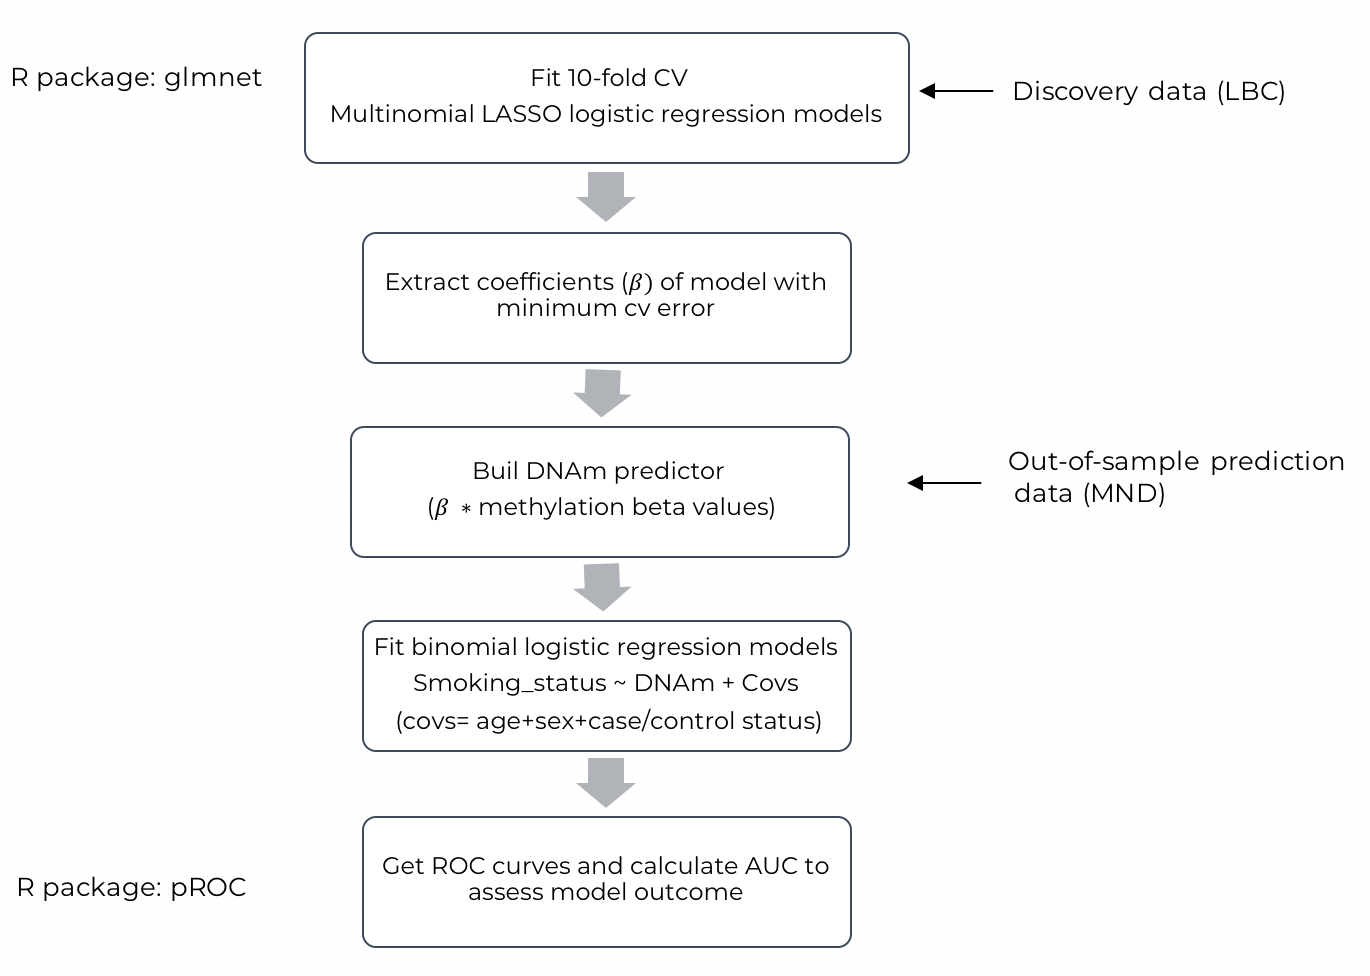
- A schematic representation of the initial analyses can be found below. The glmnet R package was used to fit multinomial logistic regression models, regularized using Least Absolute Shrinkage and Selection Operator (LASSO). Models were fit by 10-fold cross-validation, to chose optimal regularization parameter. Raw
methylation values (
Quality control and pre-processing
- Data quality control (QC) and normalisation were conducted using meffil R package. Methylation data obtained from Illumina 450k arrays was initially available for 1518 and 2217 individuals from the LBC cohort and MND cohort, respectively. Smoking phenotype information was collected from 1635 and 905 individuals from the LBC cohort and MND cohort, respectively. For the LBC cohort the following QC parameters were used:
-
Exclude probes with low bead numbers in high proportion of samples (proportion of samples with bead number < 3 is > 0.1);
-
Exclude probes with only background signal in high proportion of samples (proportion of samples with detection p-value > 0.01 is > 0.1);
-
Exclude SNP probes whose genotypes do not match their values on the microarray (concordance threshold = 0.95);
-
Exclude samples whose control probes mean value was higher than std = 5;
-
Exclude samples that failed a detection threshold of at least 3 beads;
-
the median intensity methylated vs unmethylated signal for all control probes
-
Exclude samples with high proportion of undetected probes (proportion of probes with detection p-value > 0.01 is > 0.1);
-
Exclude samples with high proportion of probes with low bead number (proportion of probes with bead number < 3 is > 0.1);
-
Calculate difference between median chromosome Y and chromosome X probe intensities (“XY diff”). Cutoff for sex differentiation was “XY diff” = -2. Exclude samples whose XY diff is higher than std = 5 (sex outliers);
-
Calculate predicted sex from “XY diff” and exclude sex mismatches;
-
Regress median methylated signal on median unmethylated signal and exclude samples whose median methylated signal is higher than std = 3 from the predicted values;
-
Exclude samples whose genotypes do not match the SNP probes on the microarray (concordance threshold = 0.8);
- For the MND cohort, the QC parameters were the same, except 3) concordance threshold = 0.9 and 12) concordance threshold = 0.9. After QC, the sample size consisted of 988 and 905 individuals, for LBC and MND respectively.For normalization, plate, chip column, chip row and sex were selected as variables to test for batch effects. The number of principal components (PCs) to use to adjust the methylation levels for technical effects was estimated by 10-fold cross-validation. The residual variance after fitting n number of PCs was plotted against the number of PCs and the number of residuals decreases abruptly at 10 PCs, for both datasets. Hence, the first 10 principal components were estimated from 20,000 most variable CpGs and regressed on the selected variables to look for batch effects, before and after normalisation. The association detection p-value threshold was set to 0.01.
Results & Conclusions
1. Similar analysis of past-smoking behavior prediction was not replicated
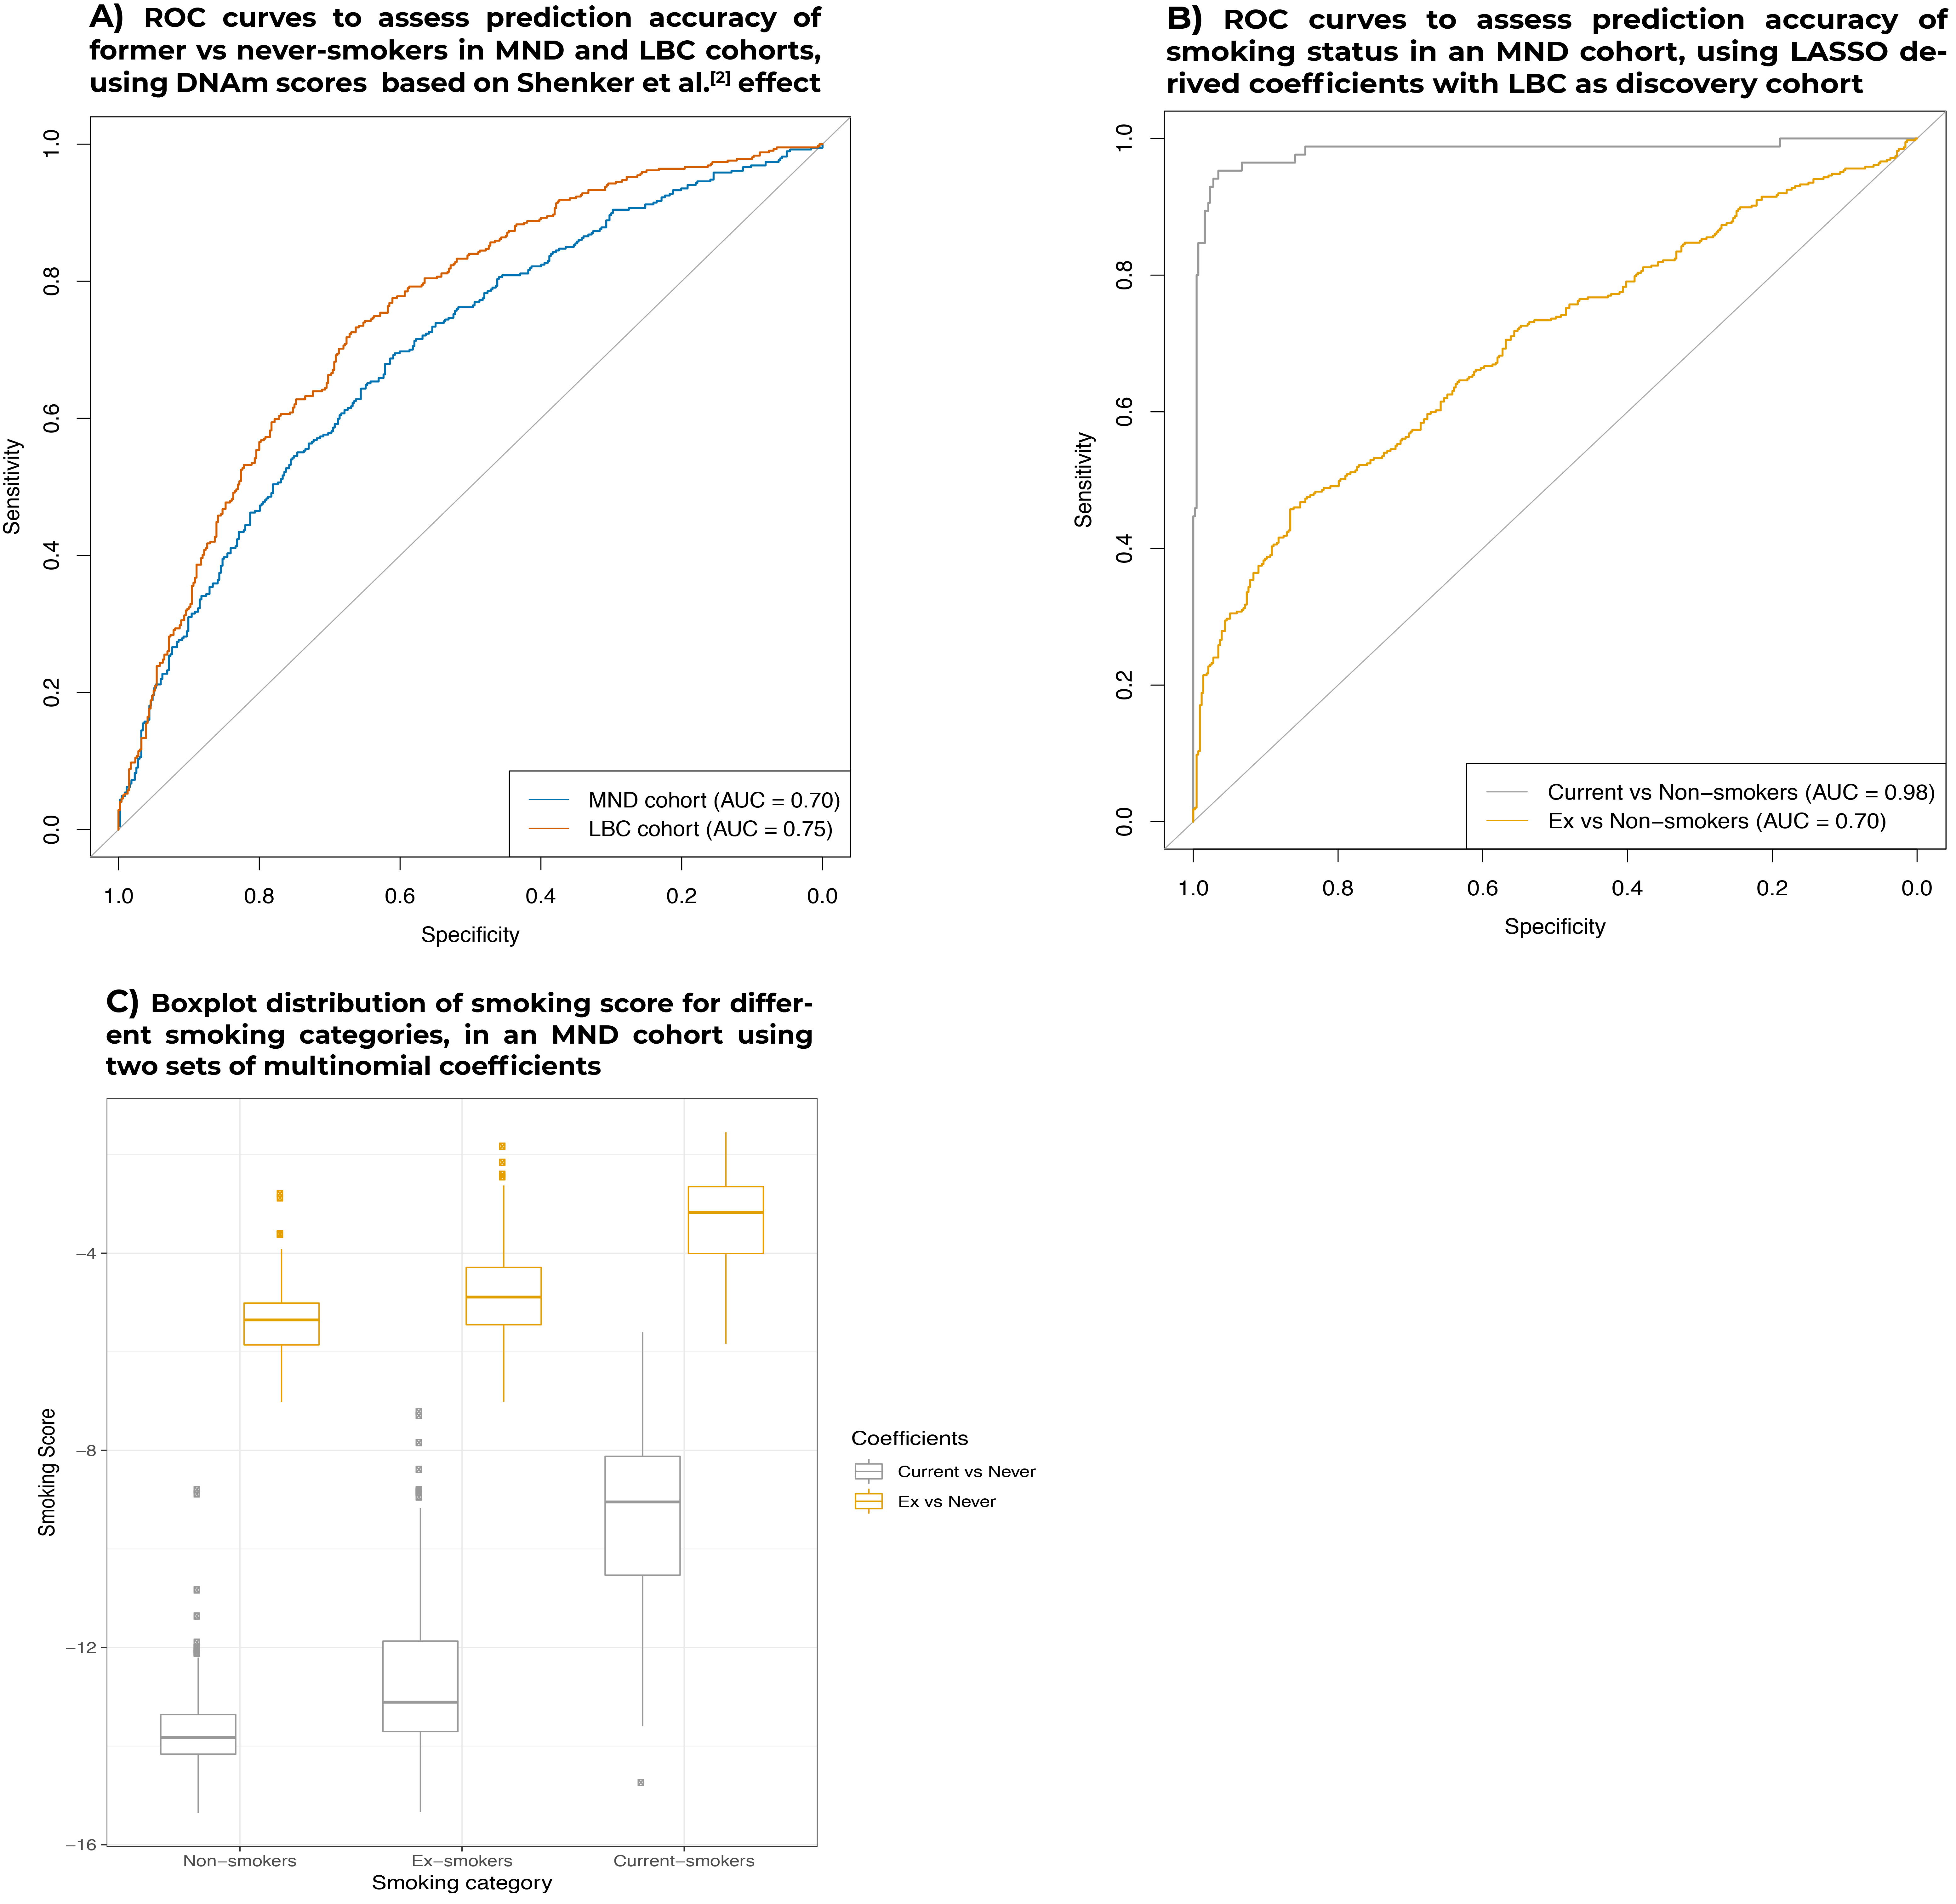
- We first attempted to replicate Shenker et al. results, calculating smoking scores for our LBC and MND cohorts, using their reported effect sizes for four genomic loci (AHRR, 6p21, and two at 2q37), as weigths. The AUCs in the MND and LBC cohorts were 0.70 and 0.75, respectively (panel A, below). As they reported predictive accuracies of 0.82 and 0.83, in their test (n = 81) and validation (n = 180) sample sets, respectively, we were unable to replicate these results in our significantly larger samples. It is noteworthy that their validation sample was drawn from the same cohort as their discovery sample.
2. LASSO derived coefficients provide high predictive accuracy when distinguishing between Current-smokers and Former-smokers versus Non-smokers
-
As expected, AUCs of ROC curves were higher when distinguishing current- vs never-smokers (0.98) than between ex- vs never-smokers (0.70), depicted in panel B.
-
Boxplots of the distributions of MND smoking scores calculated using two sets of coefficients from multinomial LASSO (see Methods) can be found in panel C. On average, using the ex-smokers effects sizes gave higher smoking scores reflecting their higher negative values compared to current-smokers (lower absolute effect sizes). Nonetheless, the overall scoring pattern remained the same between different smoking categories with average current-smokers scores > ex-smokers > non-smokers.